Rooks have flown for profit!
We offer a relatively simple reverse model, which resembles an incomplete harmonic pattern, but appears on the market much more often and reliably allows you to catch a trend at the very beginning. You should not miss such an opportunity, so let’s start.
Pattern’s fundamental conditions
The “Rook” figure is caused by the psychology of the small players mass at the stage of trend completion, including those who recently “hopped into the leaving train”.
The market has been making final attempts to maintain its current direction, but those, who do not see the real trading volumes, do not understand that large players have already stopped pouring money into sales (red pattern) or purchases (“blue Rook”).
Small players continue to enter the market, but after two or three rather strong impulses, the current trend quickly loses its strength, and market makers collect the Stop Losses of those who did not manage to reverse.
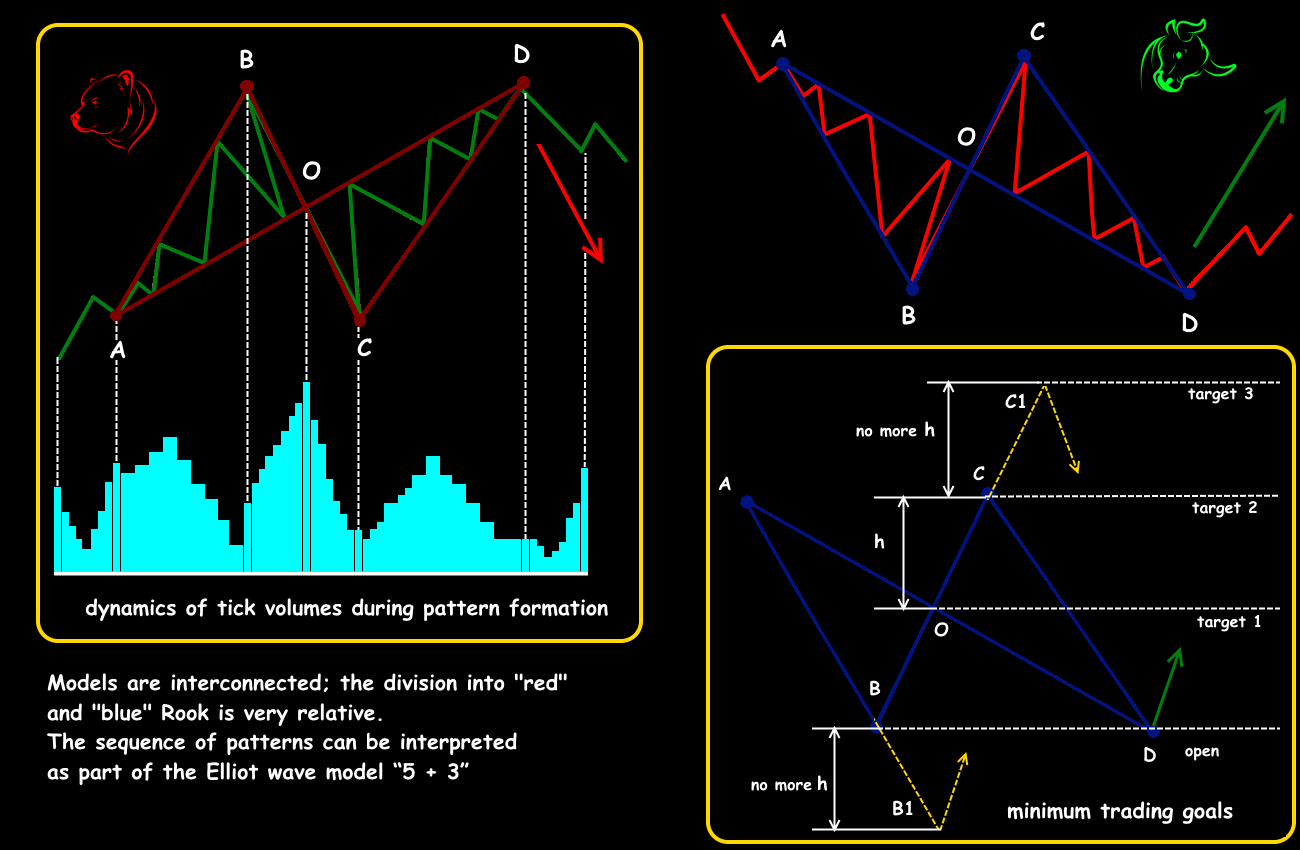
The Rook pattern: signals, targets, volumes
Another market principle works in this scheme: according to the Dow Theory, people are much more willing to buy than to sell. Therefore, the “Red Rooks” are usually longer — players do not want to give up purchases, while the “Blue Rooks” are shorter — smaller players quickly close sales and begin to “catch” an uptrend.
Technical parameters of the Rook pattern
The pattern got its name for its resemblance to a popular bird: the [AB] segment is a “tail”; the B point is a “head”; the [BC] range is a “body”; the C point is “feet” and, the [CD] segment is, respectively, a “beak”.
Let’s take a closer look at it.
The pattern’s “color” is determined according to the traditional color scheme. It is believed that:
- The “Red Rook” is formed on a bull trend (“the bird flies up”) and after the upper point gives a signal to turn down.
- The “Blue Rook”, respectively, occurs on a downtrend (“the bird falls down”), and after the lower point, a reversal to growth is supposed.
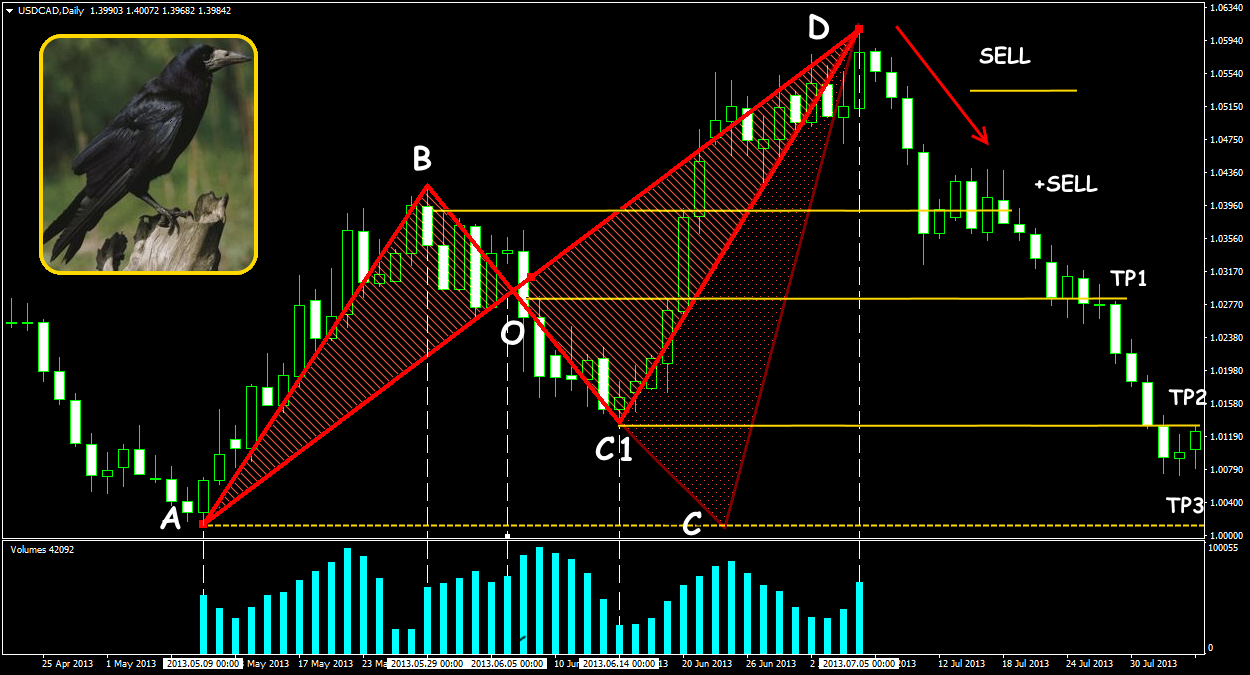
Rook: uptrend reversal pattern
Technical conditions for the appearance of the Red Rook pattern:
- There is a steady growing trend in the market — from several hours to several days.
- At some point, the price makes a strong upward throw and forms an expanding triangle (the AB line).
- Strong and quick correction downward by 70-100%, optimally — up to the pulse start level (the C point).
- New fast upward trending and the formation of a fresh local maximum (the CD line).
- After the D point, the trend finally turns down by several bearish bars with large bodies and short shadows.
We look at the target points of the pattern implementation in the diagram.
For the Blue Rook, the reverse logic applies.
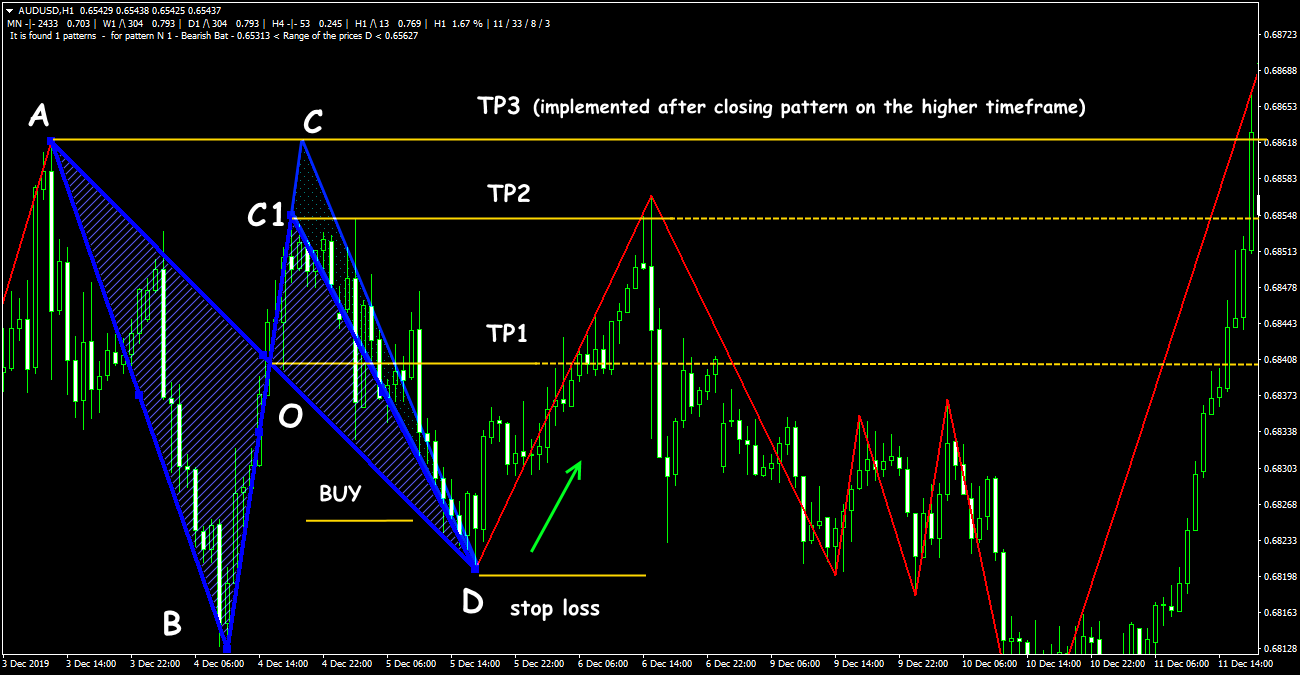
Blue Rook: a downtrend reversal pattern
The Rook pattern is traded on a reversal: the primary Stop Loss is placed above/below the D point. It is usually enough to enable trailing with a step of 50% of the average daily volatility.
Key points for profit are shown on the diagram; the maximum profit is at the A point, but the probability of its achievement is minimal. After reaching the C point level, it is recommended to close half the volume of the transaction.
The Rook pattern implementation examples
There is usually a consistent alternation of blue and red patterns in the market: smaller Rooks are formed within bigger trends.
You can build a pattern design manually — Graphic tools will help you. However, it’s easier to use the ZigZag indicator — you need to select the settings for the instrument’s volatility.
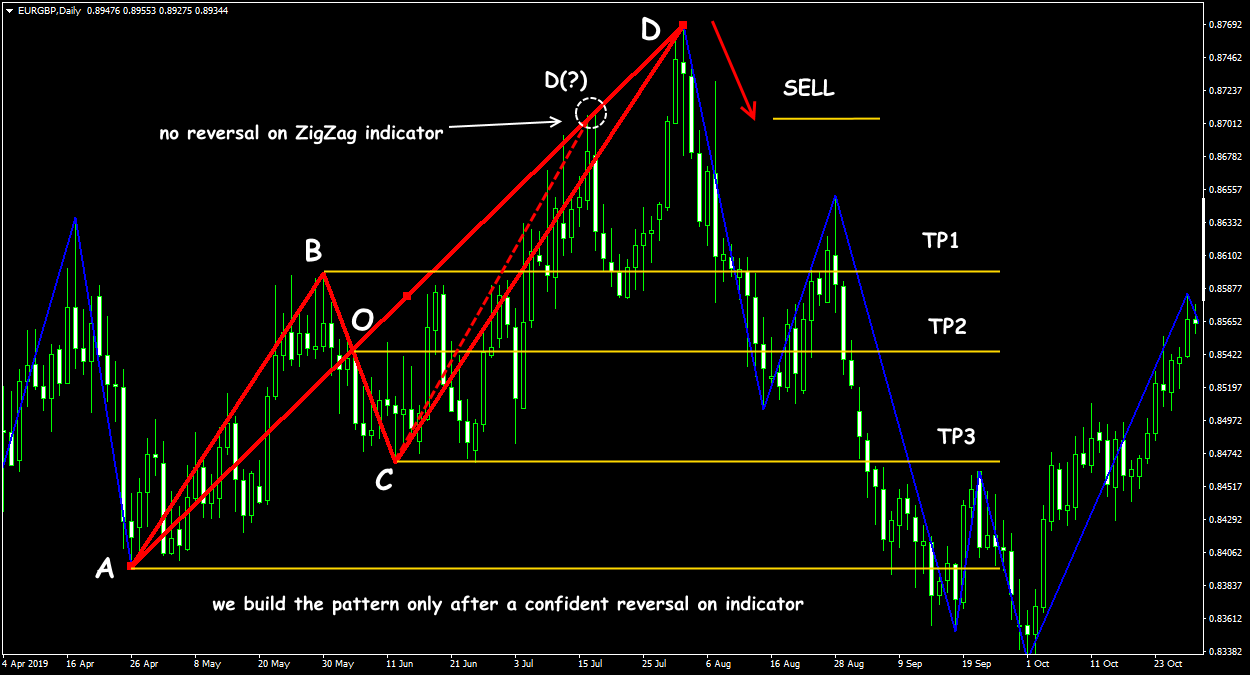
«Red Rook» + ZigZag
To determine the target points (both at the entrance and at the close), you can use the Fibonacci levels built on section A−B.
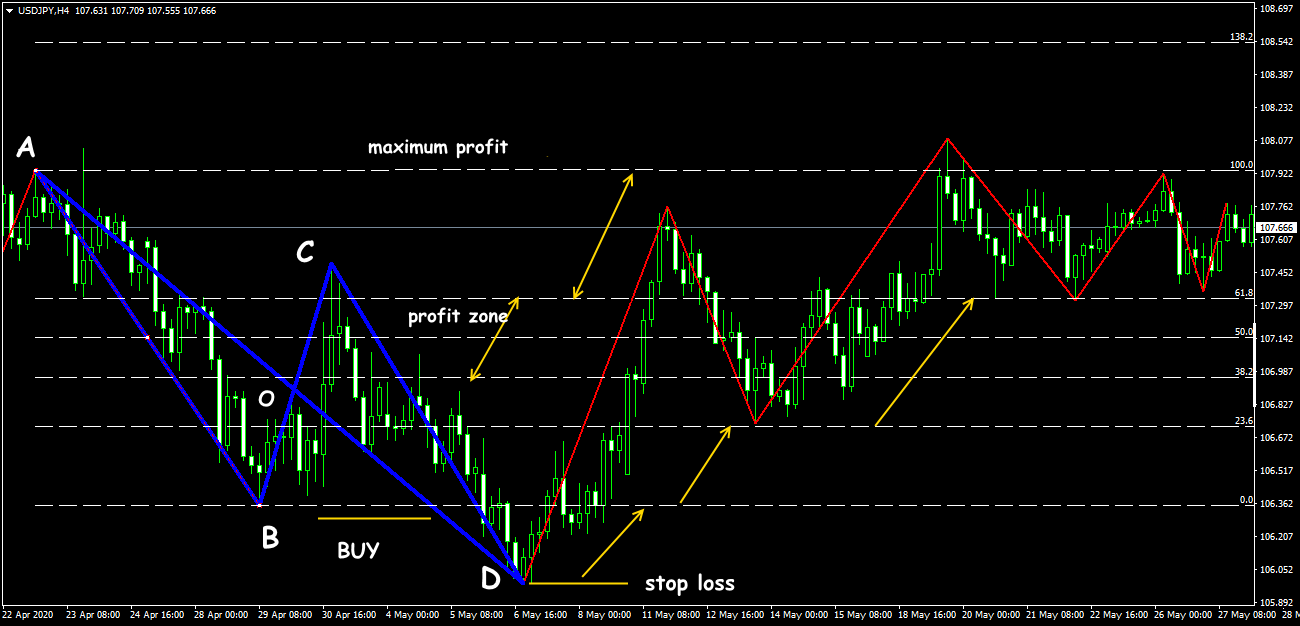
«Blue Rook» + Fibo
Like any graphic pattern, ideal Rooks are rare. It means that you need to enter after the explicit confirmation of the reversal because the endpoint D can move further along the current trend, and the pattern will have to be adjusted.
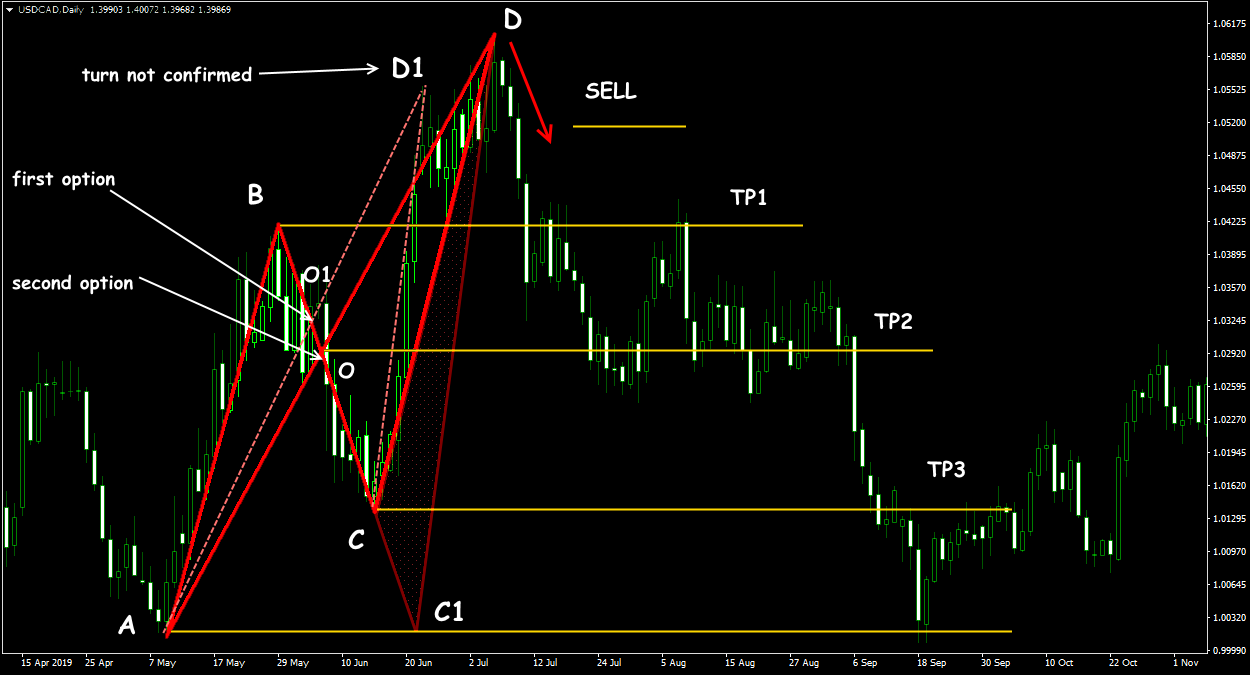
“Red Rook” adjustment diagram
The effect of the Rook is enhanced if:
- The primary trend (plot A-B) was long and strong.
- The older the TF, the more reliable the signal.
- A reversal in the pattern (from the D point) occurs in a strong price zone.
Patterns are often formed sequentially — in this case, you need to look for the formation of the largest figure, which should give the strongest and longest signal. Inside this figure, you can trade smaller models.
A few practical notes
- Rook patterns should be looked for in timeframes no lower than H1, and only in a stable market.
- “Birds” arising during periods of news, opening/closing of trading sessions, gaps, and low liquidity, are not suitable for trading under this scheme.
- The strategy is multicurrency, but it should be used carefully on assets with a large number of gaps (for example, on exotic pairs).
- The smaller the timeframe, the less “reliable Rooks” appear, but 50% of the calculated range of the pattern is usually worked out.
Try It Yourself
As you can see, backtesting is quite simple activity in case if you have the right backtesting tools.
To check this (or any other) graphical analysis you can download Forex Tester for free.
In addition, you will receive 23 years of free historical data (easily downloadable straight from the software).
 Sign Up to FTO Waitlist

