Test the mid-range Strategy Moody with Forex Tester
Variations of this method can be often seen on the net, though its popularity is holding only on using standard indicators — the mechanism of signals is clear to every newcomer. It was strongly proposed to the author of this article via several mailings under a strange name of Moody, and exactly for Asian assets. We decided to test this “moody grail” after all. So let’s begin.
The description of the strategy
The technical tools kit of the strategy may cheer newcomers, who are sure that a big number of indicators guarantee the reliability of signals. In the author’s edition of the methodology are used (see Using Indicators):
- EMA (6;0;Open); EMA(5;0;Open) — controlling the short-term trend;
- SMMA (35;0;Close) — tracking the global direction;
- ParabolicSAR (0.018;0.08) — shows the reversal moment of the trend;
- CCI (21:0:TypicalPrice) — controlling the short-term impulse;
- MACD (12;26;9;Close) — confirming the entry point.
The author’s idea of using exactly TWO short movings with the difference of 1 step remains misunderstood. The presence of these two standard EMA makes sense if they are applied to different price types (Open, Close or other), and still, the effect only can be seen on the timeframes before H1. In this case, only quicker EMA(5;0;Open) was used for the test and it didn’t affect the precision of the signals. No graphic instruments are used in the strategy.
So:
to buy: the price is higher than EMA(5;0;Open), the rupture is up the ParabolicSAR line, the MACD line crosses the bar chart and turns upwards; the CCI line crosses the level zero from down up.

- to sell: the price is higher than EMA(5;0;Open), the rupture of the ParabolicSAR line, the MACD line crosses the bar chart and turns upwards; the CCI line crosses the level zero from down up.
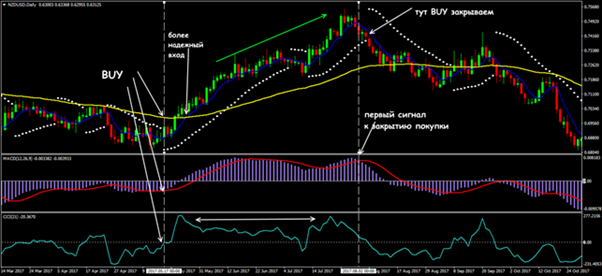
Timeframe: the author suggested D1, for supporting the deal — not lower than H4. All orders are only fixed on Take Profit/Stop Loss. It is not recommended to enter the market without confirmation on all the indicators, but there are few deals on the strategy, so we leave fulfilling this requirement to the trader’s discretion. The exit from the deal is according to the mini management or on the reverse signal.
Let’s look at it in detail.
General test conditions
The script for testing was made in Easy Forex Builder. The tests were made in the Forex Tester environment on five currency pairs (see the screenshot), conditional spread (for all assets) of 2 points; timeframe D1, Stop Loss 35 points, Take Profit 100 points, the trailing parameters were chosen by the author of the strategy.
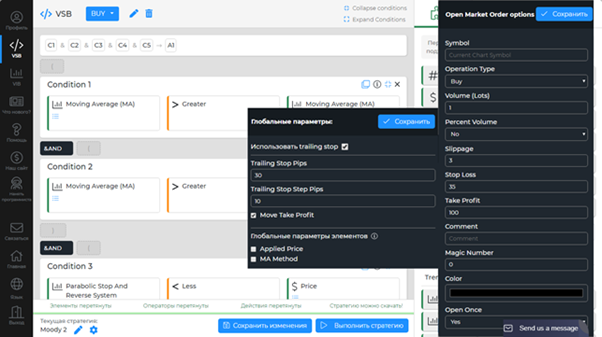
The initial deposit is $100000, leverage 1:100, minimum deal volume 1 lot. The “Bars to skip” parameter 20 (in bars) for all tests. All deals are opened and fixed automatically. The test period is from 01.10.207 to 01.10.2019. Only the test statistic is used for the analysis. Maximum load on the deposit is no more than 3 lots.

Looking ahead, we note that the test on a recommended by the author AUD/USD currency pair failed, that’s why a decision to check the method on some more assets was made. The swap size was chosen on FXCM. It is expected, that during the test period there is no funds withdrawal or deposit replenishment.
Test 1
The first test on all currency pairs was made with the author’s parameters. Unfortunately, two of five pairs basically “drain” the account, moreover, quickly enough, the author-favoured aussie showed the negative result as well with the low number of deals. See the results and balance of the most “failed” pairs on the screenshot below.
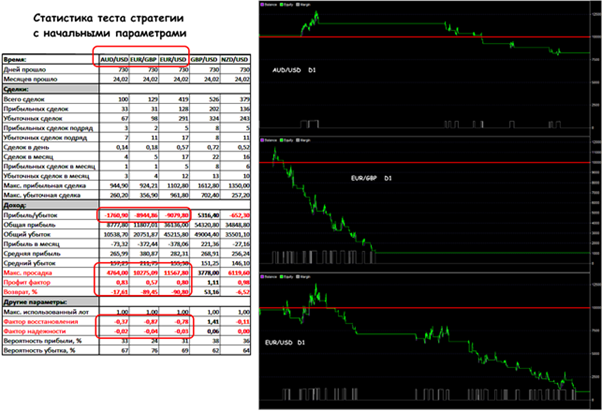
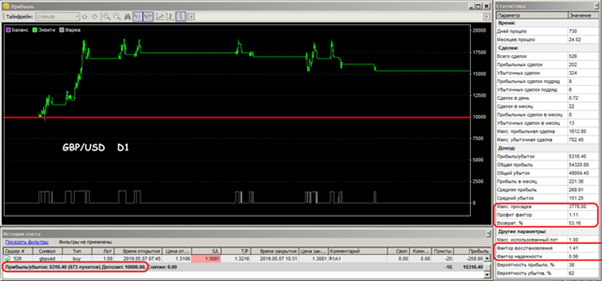
The low number of deals on the AUD/USD and EUR/GBP is surprising, meanwhile, the proportion is obviously not on the favour of the profitable ones. The risk is minimal, there are no more than 2 lots in the work simultaneously. The profit-factor and sustainability rate are below optimal even for the GBP/USD — the only currency pair, which finished the test in a profit.
Practically for the whole test duration, the pound/dollar was in a profit, which, as a whole, is strange for such a volatile asset. There are almost no false entries. Obviously, the optimal trading parameters for the given pair provided precise “grip” with the trend, and all speculative moments were ignored by the strategy. Someone may consider 50% of profit for two years as little, but it is actually a normal result for a stable and mid-term strategy with minimal risk.
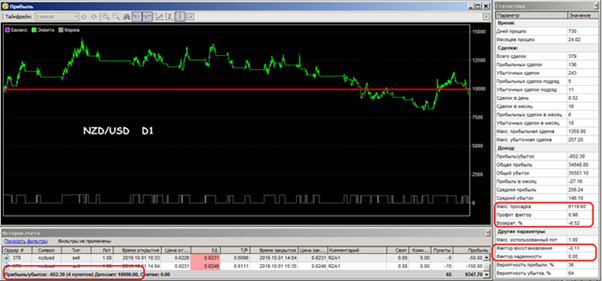
The result of NZD/USD may be considered quite good, though the midday volatility of this asset is significantly lower. The pair was remaining above the balance for almost the whole test and failed only on speculations of the last two months. The statistic indicators are weak, but it may have a chance on minor periods.
The result? Score 4:1 in favour of loss will hardly attract enthusiasts to this methodology. Stable loss comes also both on trend areas and during the flat. The statistic indicators are very weak, but we shall try to experiment with the two most successful assets.
Test 2
Conditions: we shall run two more tests for the GBP/USD and NZD/USD each, we leave the trailing and Stop Loss/Take Profit parameters unchanged. The goal — to catch a profitable movement on smaller periods H4 and H1.
This is what we got as a result:

Decreasing the period catastrophically worsens the result. The number of deals for the GBP/USD grew two times on H4, shrank on H1, but the result is the same — the account “dumps” even before the end of the test, moreover, way faster on H1. The analysis of the operations journal has shown that losses on H4 emerge through the frequent Stop Loss triggering, on H1 — through speculative lunges. There are moments when 2-3 deals were opened simultaneously, but the risk requirements are not violated as a whole.
The positive result for kiwi on H4 is too small to consider the whole test successful. Almost the same profit as the loss in the test D1 came out on the absolute value, it means the result is, to say the least, low-quality. Let’s look more precisely.
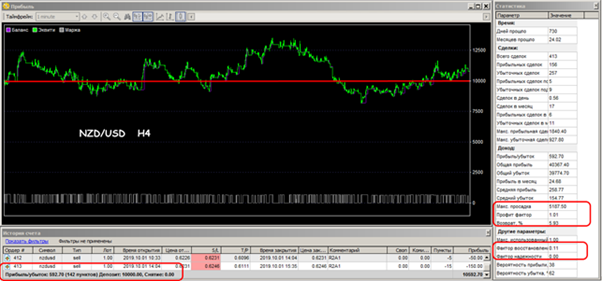
The pair spent almost the whole test in the zone of initial balance, albeit refrained from critical subsidence. The stability of a positive result is low both on the trend and flat areas, the statistic indicators are very weak.
The result? Decreasing the working timeframe below D1 for the given strategy is strongly not recommended.
And yet we shall try to improve the result on the GBP/USD pair — there is a suspicion that too close Stop Loss takes a part of the profit from this volatile pair.
Test 3
Conditions: we’re testing the pound/dollar with the new parameters: we shall increase the range of the trailing “inclusions” (TrailingStopPips) to 40 points and the trailing step (TrailingStopStep) to 20 points. Possibly, a correction of the parameters will allow using the strategy more effectively, but it is important to remember that there is almost no reserve for the recovery parameters, so we’re not raising the risk.
The result? Basically, the calculation for a longer trailing proved worthwhile: the profit eventually came 70% more, and at the moment reached 200%. Maximum subsidence in the profit zone. There is no subsidence below the initial level at all. The strategy would have resisted with such parameters, even if a part of the profit would be withdrawn from the deposit in the process of trades. Through the Stop Loss not hurrying to pull-up to the price (20 points instead of 10), deals started taking more profit on speculative movements. The overall number of deals increased by 30%, but the proportion of profitable/loss-making has remained. However, the profit-factor is below optimal and the stability indicators are not encouraging as well, but if there is such reserve of profit, then it is acceptable to neglect the negativity of the statistic.
Conclusions and recommendations
We remind: all tests were run without manual interfering into the process.
In our view, the Moody strategy is overloaded with indicators, which probably should compensate the trader for the absence of fundamental analysis. It means that indicators only repeat, but don’t complete each other. Emerging signals are practically not shifted for time, as a result, the methodology fails with the same “success” both on the trend and flat. Timeframes that are below D1 are strongly not recommended. We recommend our readers to check the chances of the AUD/USD with the change of parameters themselves. After all, the pair was in a small profit quite long enough with the author’s conditions, and eventually its losses came not that catastrophic, as the assets with the euro participation did.
Try It Yourself
As you can see, backtesting is quite simple activity in case if you have the right backtesting tools.
The testing of this strategy was arranged in Forex Tester with the historical data that comes along with the program.
To check this (or any other) strategy’s performance you can download Forex Tester for free.
In addition, you will receive 23 years of free historical data (easily downloadable straight from the software).
 Sign Up to FTO Waitlist
