English
 Deutsch
 Italiano
 Français
 Español
Testing the KumoBreakout strategy based on the Ichimoku indicator using Forex Tester
Script for testing the strategy was created in Easy Forex Builder. The Tests were conducted in the environments of Forex Tester on the AUD/USD, EUR/USD, GBP/USD currency pairs (2-point spread); timeframe H1. The initial deposit is $100000, leverage 1:100, minimal deal volume is 1 lot. The “Bars to skip” parameter defines the range of the search for a trade signal (in bars). All trades are open and fixed automatically. The test period is from 01.01.2017 to 07.08.2019. Only the test statistic is used for the analysis. Maximum load on the deposit — no more than 4 lots. Tests are conducted consistently on all chosen assets.
The description of the KumoBreakout strategy
Mid-term trend strategy suggests an entry on the Ichimoku Cloud zone breakthrough with the trend confirmation on the oscillator.

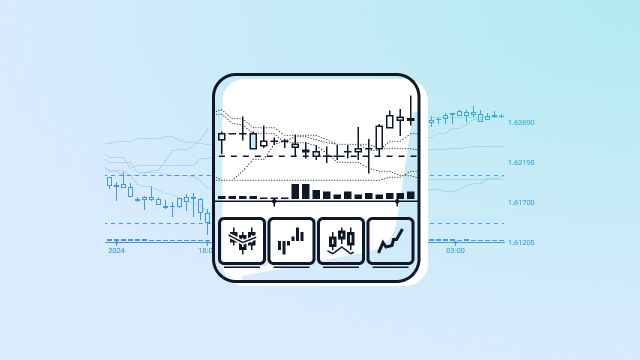
You will need (see Using indicators): Ichimoku(8;29;39) — the lines Tenkan-Sen, Kijun-Sen and Chinkou Span are off; AwesomeOscillator with standard parameters.
- buy: penetration of the upper Kumo border and turn of the AO bar chart from down up (see Graphic tools);
- sell: penetration of the lower Kumo line, turn of the AO bar chart from the top down.
We close on the reversal breakthrough of the zero line by the AO bar chart or on the test modalities.
Let’s begin.
Test 1 “Reverse”
Terms: the deal is fixed only with the appearing of the reverse signal upon the strategy. Take Profit, Stop Loss, trailing and manual trading are not used. The “Bars to skip” parameter is at 100.
Overall statistic

The deposit account is practically lost, maximum subsidence at the margin-call level. Attempts to recover are weak. Considering that aussie was chosen as a weak-speculative asset with a solid mid-term trend, a similar result tells that both trend and flat areas are worked out equally bad.

There is no catastrophic fall, as well as strong growth. The loss of almost 25% of the deposit occurred in the period of strong speculations, the maximum subsidence of 50% was quickly compensated to the level of $7000 where the situation “stabilized”. Average profit is more os average loss, but the trend areas are worked out bad. reverse signals delay. It is possible to take a small profit at the level of 20-50 points in a wide flat, but many fake signals emerge and the number of profitable deals is almost two times smaller of loss-making ones.

The asset managed to show a positive result, though the number of deals is significantly lower. With the failure on the first stage of the test, we managed to handle it, though the statistics of recovering is weak as a whole. All the profit then was lost “in expectation” of reverse signals: it can’t be serious to open a 1-pound-deal each month and eventually get a profit of 120 points over 2,5 years of the test. The profit-factor is below normal, the strategy can’t be considered steadily profitable. The account was saved only due to the volatility of the asset, which allows to compensate for the losses speculatively quickly in a few deals.
Risk analysis: the load on a deposit is the lowest, only one deal with the volume of 1 lot is constantly opened.
Result? A logical outcome for reverse trading. The strategy fails on the trend and gives many fake signals in the flat. It is strongly not recommended for practical use.
Test 2 “Long stop”
Terms: Daily average volatility over the past 3 years on AUD/USD, EUR/USD, GBP/USD — from 50 to 140 points.
We try the option with a fixed stop at the max value level. Take Profit at 100 points and Stop Loss at 60 points provide a small supply of a profit (the profit/loss rate is about 1,5:1), but in this case, we count on a rather rare stop triggering. “Bars to skip” parameter is at 100.
Overall statistics

Maximum subsidence relates to the profit zone. The account for the whole test period is in profit, but the result is rather modest. In the period between 15.04.2018 and 01.10.2018, the most of the profit was lost for the fundamental reasons: a series of negative deals occurred because of active speculations, while the price in the flat simply couldn’t reach the 100-point profit. The recovering indicators are below normal.

Subsidence at the beginning of the test is insignificant, the maximum subsidence is in the profit zone. The positive result is stable, but the indicators of recovering are weak, the profit factor is below normal. Much of the profit is lost over the past 6 months, mostly because of fake signals on speculations.

The pound has shown very few signals and the profitable among them are just 30%. The losses are about 70%, all the statistic is negative.
Risk analysis: average load for the deposit is about 2 lots, dangerous mini management tactics are not used.
Result? Despite two positive results, the margin of profit is obviously not enough: the profit factor everywhere is below normal, the recovering indicators are weak.
Test 3 “Short stop”
Terms: we shall increase the profit/loss balance: Take Profit/Stop Loss — 100/40. We wait for profit at the same level, but we expect to close losses earlier. We save the “Bars to skip” parameter at 100.
Overall statistics

We got rid of the subsidence on the first stage, the profit-factor is perfect, but the recovering indicators are weak. After all, the strategy reacts to speculations badly, but 50% is a good result too. There are more deals now, but through the loss-making ones.

All the profit was lost on speculations at the last stage of the test, the peak profit and the overall result appeared to be worse, than in the previous option.

The deposit leaks even faster than with 60-point Stop Loss. These parameters are obviously not an option for this currency pair.
Risk analysis: the maximum load of 2-2,5 lots is not critical for the deposit. A few deals are opened only in a flat, but in disadvantageous situations for the deposit.
Result? Decrease of Stop Loss improves the situation only for one currency pair, so one should be cautious using such method. We don’t recommend experimenting with volatile assets.
Test 4 “Step reduction”
Terms: We shall try to lower the period of analysis and decrease the requirements for stop orders: Take Profit — 75 points, Stop Loss — 25 points, meanwhile the profit/loss rate is 3:1. The “Bars to skip” parameter — 20. We count on the increase in the number of deals in general and the balance shift toward the profitable ones.
Overall statistic

The highest result among all options of the given test, perfect statistic indicators. There are more deals now, but the profit/loss proportion remains practically unchanged.

A solid gain of profit at the first stage and the result retention on speculations suggest that the chosen proportion of 75/25 for Take Profit/Stop Loss is optimal for this asset. The statistic indicators are excellent, though the series of 17 loss-making deals is a bit alarming.

Stable but weak enough (as for pound) profit, the profit-factor is below normal, the indicators of recovering are weak. Again, a dangerous series of loss-making deals. 25-point Stop Loss for the GBP/USD is obviously not an option.
Risk analysis: the maximum load on the deposit is 2-2,5 lots.
Result? Reduction of the timeframe and the step for the search of signals improves results on all chosen assets. On M30 the strategy sees more successful entries, but the highest result shows an asset with calm volatility.
Conclusions on the results of the tests
We remind: all tests were carried out without any manual interfering into the process. The tests showed that the strategy is firmly positive on the given assets on the M30 period, on H1 the result strongly depends on the market conditions. We recommend excluding the option for reverse. Ideas of a fixed profit should be strictly attached to the volatility. Speculative moments are not worked well. In the narrow flat, there are a series of ineffective signals, so the profit/loss should be kept at least 2-2,5 to 1.

Analysis of individual assets confirms the overall conclusion. The most stable option from the given test — 75/25.

One should use this strategy very carefully on speculative assets like the GBP/USD. The method is strictly attached to the building of the Kumo Cloud, the signals lag behind, trend areas are often skipped, that’s why so few deals are made. This means that KumoBreakout should be used in a bundle with more active methodologies.
Try It Yourself
As you can see, backtesting is quite simple activity in case if you have the right backtesting tools.
The testing of this strategy was arranged in Forex Tester with the historical data that comes along with the program.
To check this (or any other) strategy’s performance you can download Forex Tester for free.
In addition, you will receive 23 years of free historical data (easily downloadable straight from the software).
 Sign Up to FTO Waitlist