Your friend Bollinger Bands or why the classic is always relevant
The main idea of an indicator, which has become classic, was proposed in 1987 by the famous Perry Kaufman in his book The New Commodity Trading Systems and Methods. The familiar form of Bollinger Bands is the author’s development of the American analyst John Bollinger − first proved its worth in the futures markets, and later it proved to be stably effective also on more speculative currency assets. Statistics show that 75% of the trading time the price spends within two and 85-90% of the time − in the range of three standard deviations.
Today, this indicator is considered a powerful trend tool and is actively used in trading strategies in almost any market environment. We also need it very much.
So let’s begin.
Logic and purpose
Bollinger Bands indicator is one of the first but really effective variants of the price ‘envelopes’, which the stock market shared with us. The main task is to place the whole price movement in a certain corridor with dynamic, but rather rigid borders, which must be backed up by trade volumes (see here Bollinger Band).
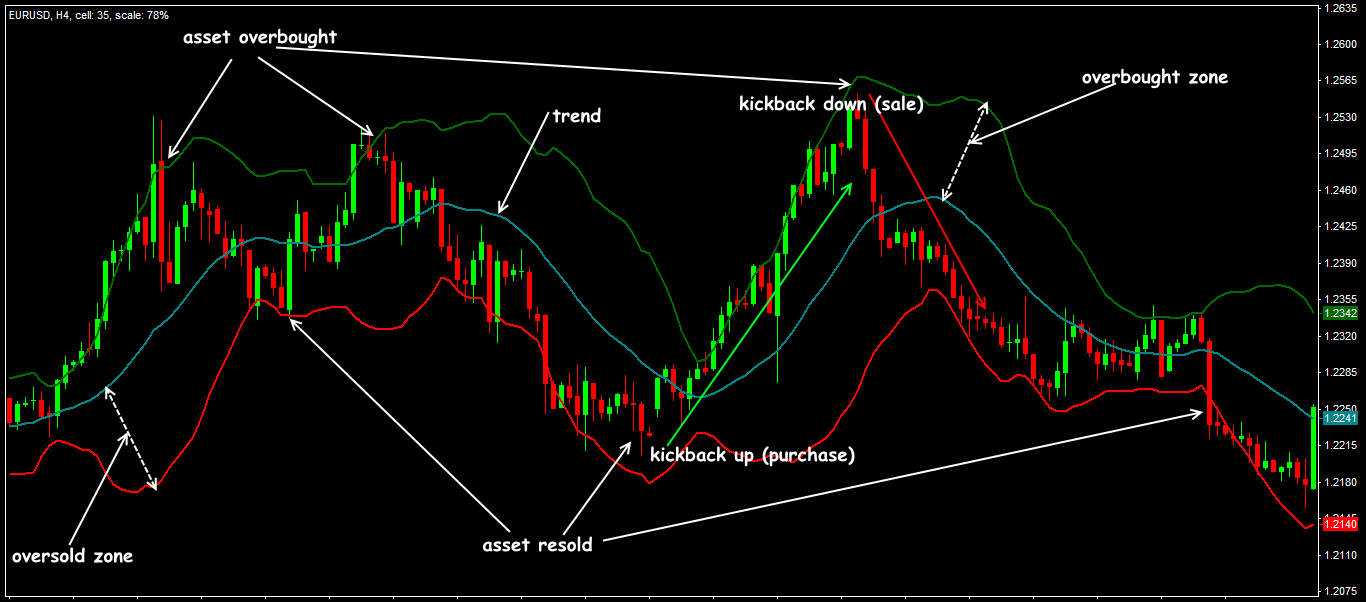
If the price is out of the upper line, then the asset is too overbought, if the price has fallen below the lower limit – it’s oversold. Further, according to the Efficient Market Hypothesis, participants must respond quickly and return the price to the zone of its fair value, that is, to the central trend line.
- if the channel expands − volatility increases − the current trend intensifies;
- if the boundaries of the bands begin to converge − volatility falls − the current trend is weakening.
At the same time, market volumes should show similar dynamics.
Calculation procedure
The indicator statistically evaluates the location of the prices in relation to the normal trading range (see what is the normal distribution), or how far short-term traffic can go before the price has to return to the main trend.
Volatility is estimated with the help of the standard deviation value (in Excel this function is called STDEV − standard deviation): the indicator calculation mechanism itself regulates the channel’s width.
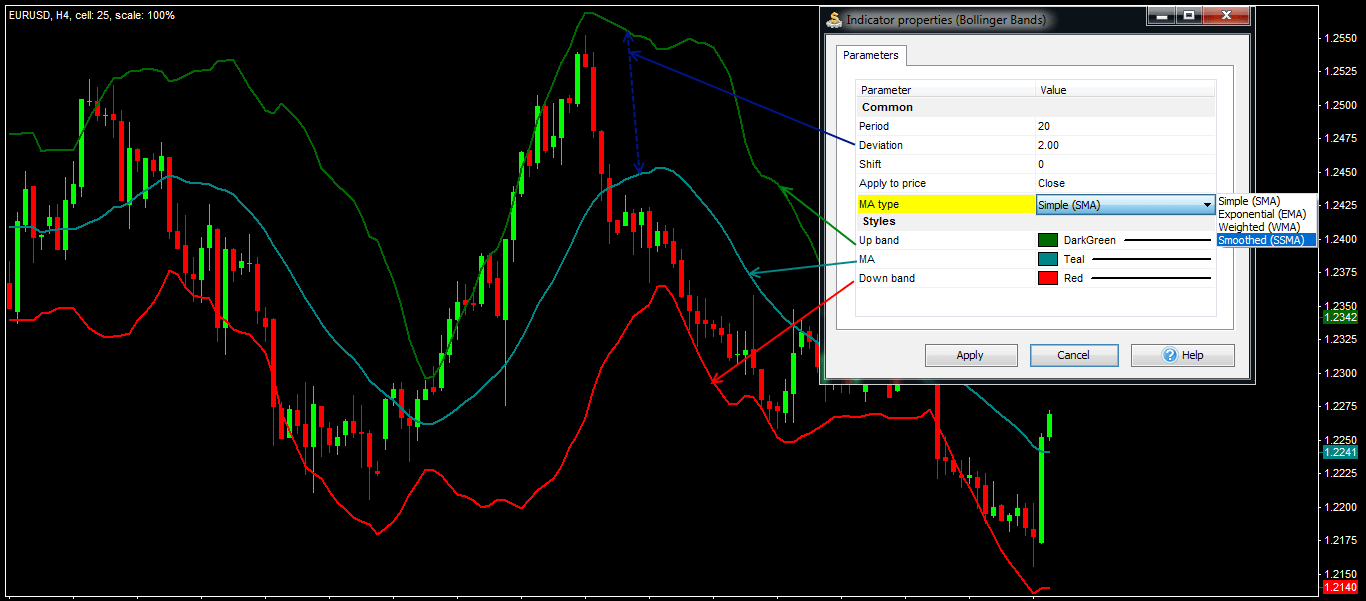
The indicator builds on the price chart a channel of three dynamic lines. The central line is a moving average (of any type), the top and bottom lines are shifted up/down with respect to the central line by a number of standard deviations from the moving average for the analysable period, that is:
Parameters of the indicator should be adjusted so that 90-95% of the price movement is within the channel and only 5-10% − beyond its limits.
Parameters and configuration
The standard version is included in the package of all popular trading platforms; the basic parameters are the same, the differences can only concern visual display.
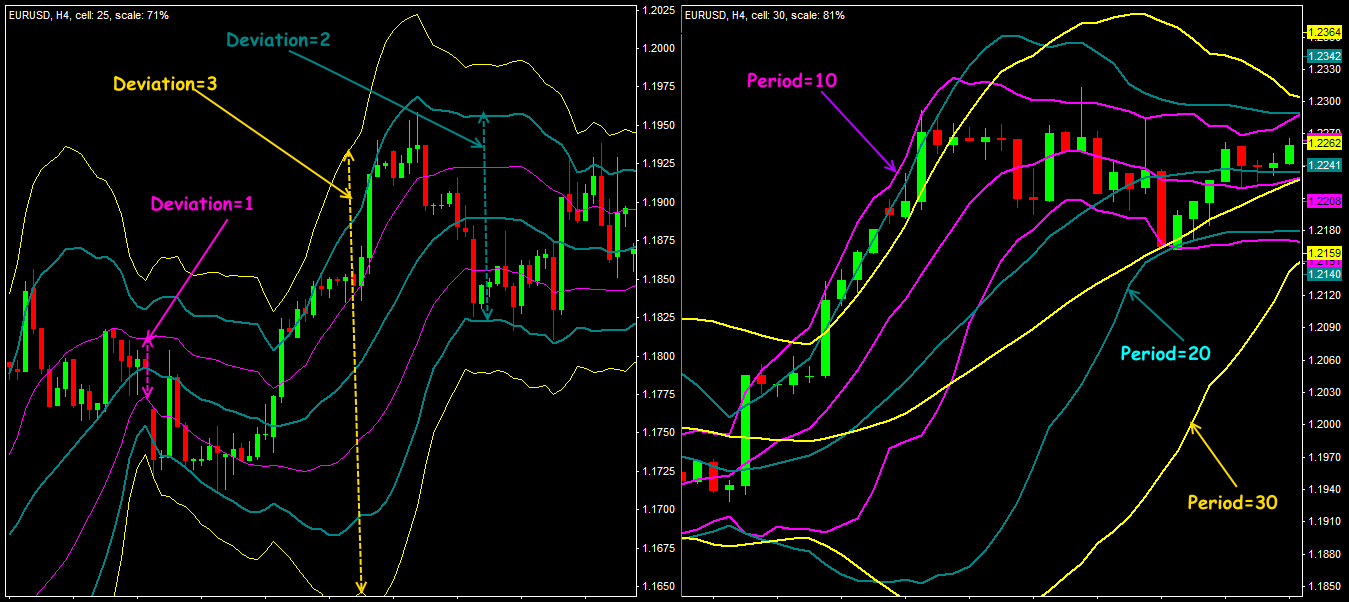
The recommended range of the Period parameter is from 13 to 30; the most popular value of 20 stably works on all foreign exchange assets; you can use the Fibonacci base numbers, «round» values (50, 100, 150, 200), the number of days in the trading and calendar years (240, 365).
Little reminder: if the period value is too large, it reduces indicator’s sensitivity, which is especially harmful for the assets with low volatility. If the price crosses the borders too often – it is recommended to increase the period value, and vice versa.
Sometimes, for the correct choice of the period, it is recommended to observe how the price behaves when the «Double Bottom» (for the bottom) or «Double Top» (for the top) pattern forms in the borders line zone: the second key point (Bottom or Top) should remain within the Band. If this point is out of the channel’s boundaries, then the period is too short.
- from M1 to M15 − 10;
- from M15 to H1 − 20;
- from H1 to D1 − 50;
- more than 1 day − 60.
Type of the price: for the forex assets, as a rule, the closing price is preferred, although the author himself used an average-weighted price (but he was working on the stock market!); for high-volatility assets it makes sense to apply average and typical prices.
The value of the standard deviation shows how far from the average value the current price has gone and is calculated automatically by the system. With an increase of the deviation value, the common channel expands and includes more price movements. Value range: from 1 to 5, the recommended value of 2 is quite acceptable for trading assets with stable volatility.
The Shift parameter can also be selected taking into account the price dynamics − it corrects the current lag. All parameters can be varied.
Now let’s look at it in detail…
Trading signals of the indicator
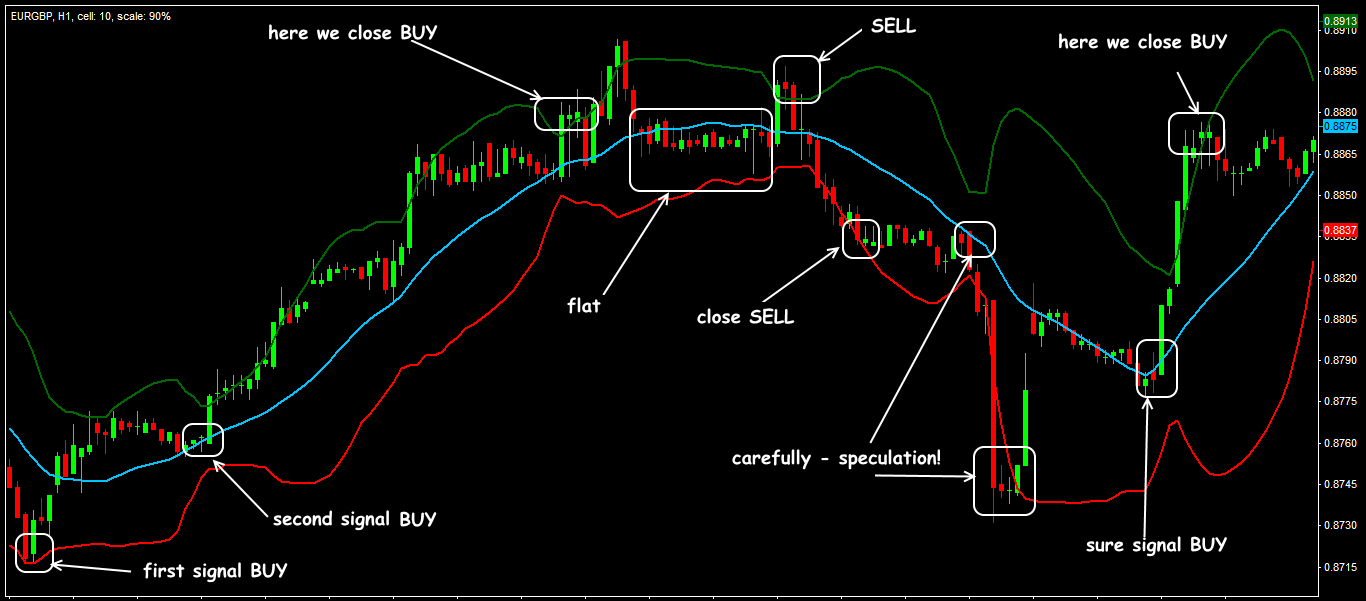
It is assumed that the middle line of the indicator follows exactly the trend:
- during the flat periods, the boundaries are almost parallel and the price moves inside the channel;
- during the strong trend periods, the angle of inclination indicates the strength and direction of the movement.
- a rollback from the top/bottom line on the expectation of the movement to the opposite channel’s boundary or at least, to the middle line;
- breakdown of the channel’s boundary with further movement in the current trend: above the upper limit − BUY, below the lower limit − SELL.
The result?
Dynamic lines of the bands are considered boundaries of the overbought/oversold zones. At the same time, the top and bottom lines work as strong dynamic support/resistance levels, so using the indicator in countertrend strategies (entry into the transaction after the price returns to the price channel zone) is considered less risky.
Application in trade strategy
The following trading tactics are the most recognized and widespread:
- Price is out of the indicator
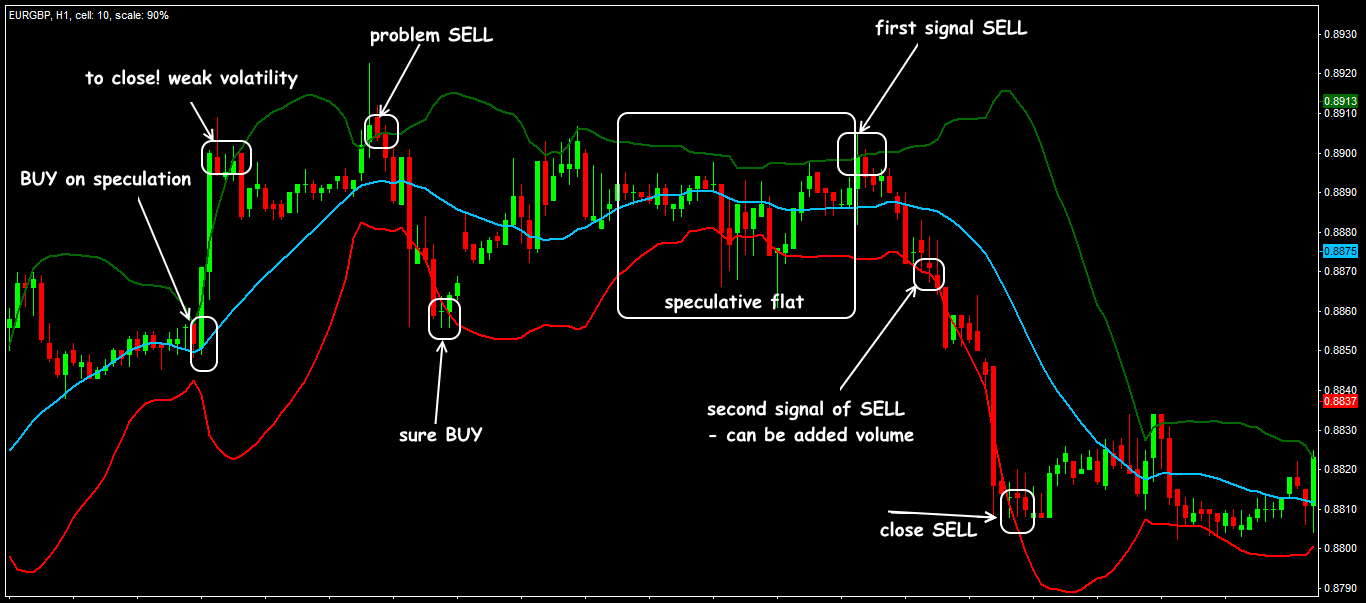
If there is a lull in the market for a long time – wait for the storm: it is expected that a strong trend will begin or continue. A position opens in the direction of the prevailing tendency after the confident closing of 1-2 candles beyond the borders of the strip (see here Learn Four Powerful Bollinger Band Trading Strategies).
- Continuation and reversal of the trend
Large volumes entering the market quite often push the price out of Bollinger Bands. However, trading against such a movement is risky, since the market can take short series of very volatile fluctuations before the reversal comes, and knock out your Stop Loss. If when the price approaches the channel’s border, the angle of line inclination decreases, then, most likely, the price will break it and only then it turns around.
Carefully watch whether the price will slowly bounce back, and whether the Bollinger Bands channel will open at the same time. If so, this will be a signal for the impending breakthrough of the border and the continuation of the movement.
- Graphic patterns coming with Bollinger Bands
It is planned to develop graphical rotation patterns which arise directly in the boundary zone. The process of identifying such patterns is greatly simplified if we analyze the appearance of key points in relation to the lines and ignore the facts of absolute price values (see Using Graphic Tools).
What can be inferred from these situations?
What this means is:
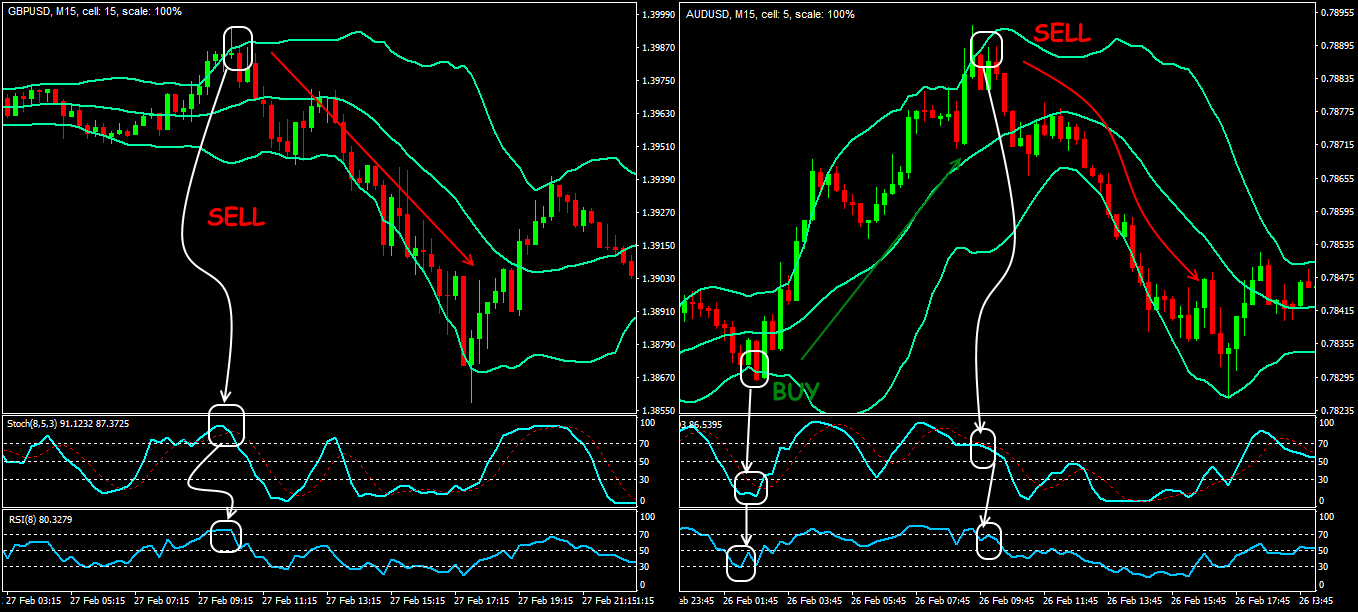
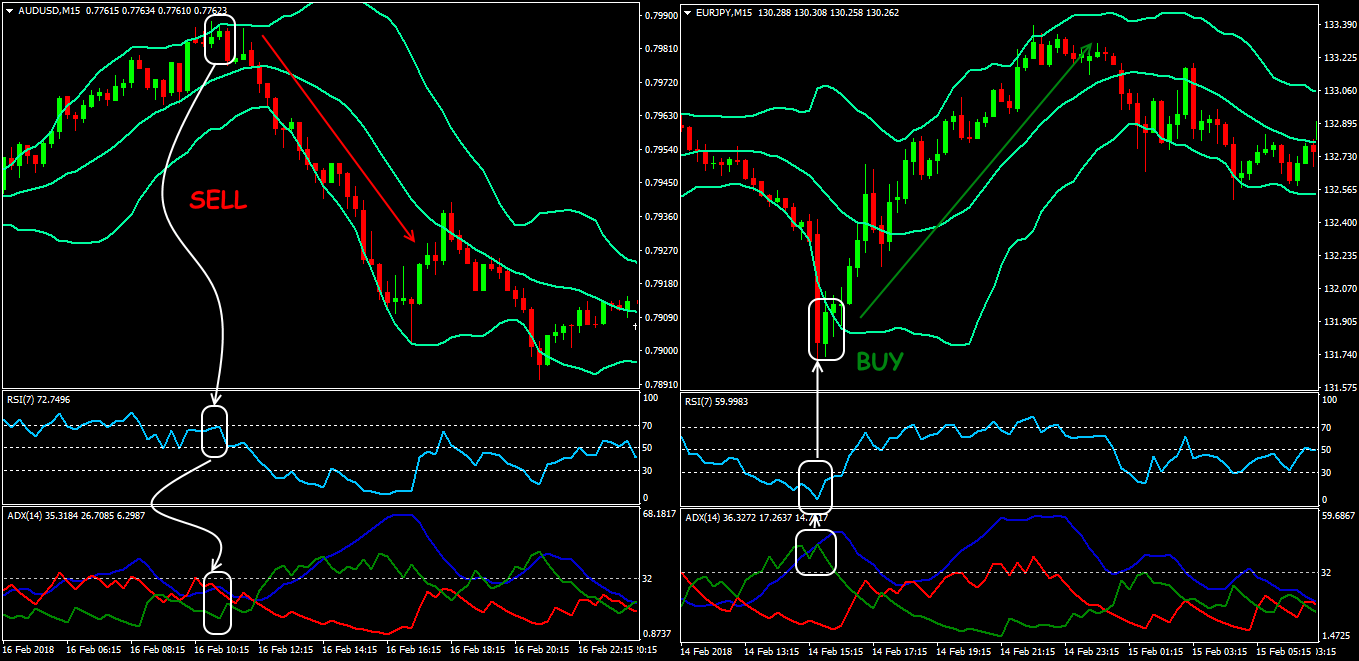
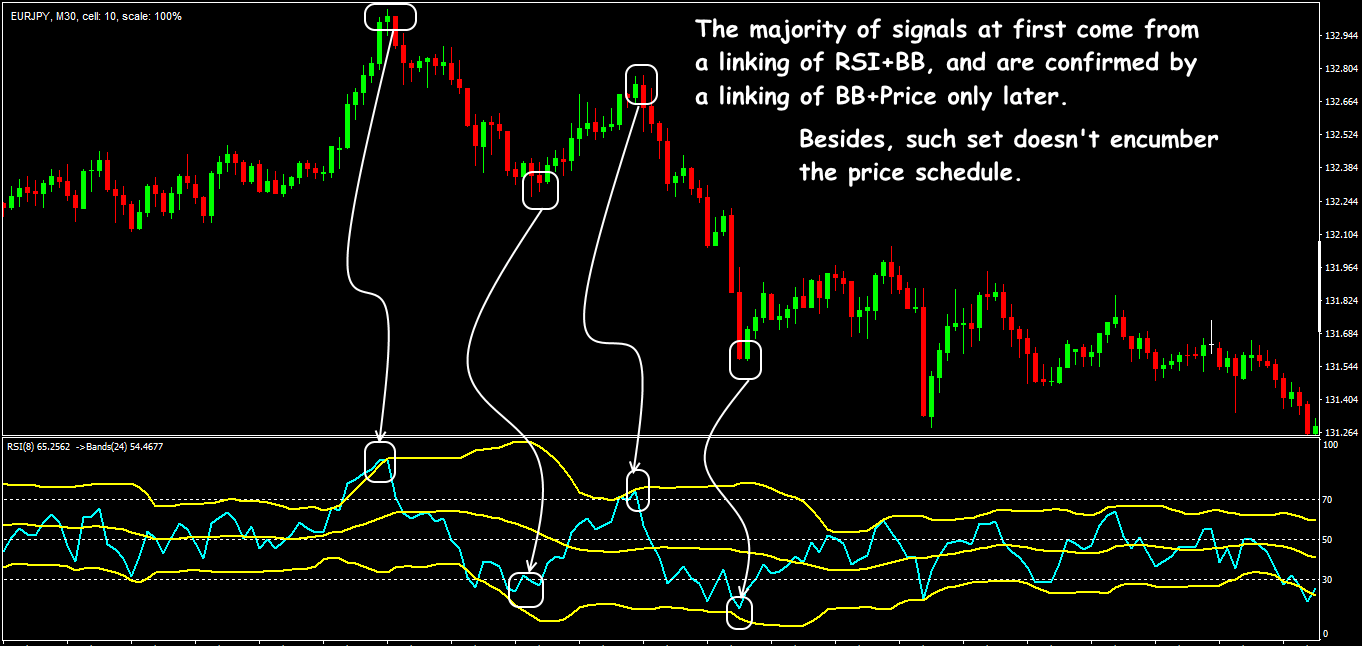
Bollinger Bands are mostly used in the trend systems, where the input is made in the direction of the trend after some rollback. In addition to relying on the central line, it is also logical to use any sufficiently sensitive oscillator, for example, Stochastic, RSI or WPR (see Using Indicators), in order to confirm the end of the rollback (see here Bollinger bands explained simply and understandably).
Several practical remarks
Among the undoubted strong points of Bollinger Bands, we distinguish two most important: identification of the trend and evaluation of the market activity.
We can consider as disadvantages the traditional for moving averages lag and some subjectivity of the price behaviour evaluation near the channel’s boundaries. Efficiency also depends on the stable volatility of the asset: speculative shots «break» the calculation logic, and incorrectness of the signals in the illiquid markets and markets with low activity was noted by the author of the indicator (see his Bollinger on Bollinger Bands).
Nevertheless, Bollinger Bands test the hidden nature of price fluctuations much more efficiently than most trend instruments, and immediately let us know whether the secret «door» behind which our stable profit hides is open or locked.
Was this article useful for you? It is important for us to know your opinion – share your comments down below!
Try It Yourself
After all the sides of the indicator were revealed, it is right the time for you to try either it will become your tool #1 for trading.
In order to try the indicator performance alone or in the combination with other ones, you can use Forex Tester with the historical data that comes along with the program.
Simply download Forex Tester for free. In addition, you will receive 23 years of free historical data (easily downloadable straight from the software).
 Sign Up to FTO Waitlist
